Konrad Gerischer
Explorative immune cell population differentiation analysis in Alzheimer's disease patients and healthy individuals
Konrad Gerischer presents his Master's thesis about differences in the expression of immune system-related genes between Alzheimer's patients and healthy controls.
Background
Alzheimer’s disease (AD) is a widespread neurodegenerative disorder affecting cognition and memory. While current biomarkers use the main known biological constructs that play a role in disease pathology (mainly accumulations of the amyloid beta and phosphorylated tau proteins at varying neuronal sites [1]), there has been research associating AD to immune system dysregulation. Peripheral immune responses have been researched in the past [2] but are not as well explored in this regard, potentially giving rise to recently emerging diagnostic tools through blood testing [3], which is cheaper and less invasive than procedures that obtain amyloid or tau markers.
A facet of the differentiability between immune cell populations of AD patients and controls may be examined via comparative statistical analysis of simulated protein expression and behavioral data of leukocytes. For this purpose, a longitudinal dataset depicting the development of such cells (here T-cells and monocytes) over time was previously simulated [4] by the Department of Biomedical Engineering of Tel Aviv University.
Methodology
Insights into patterns of immune response-related RNA expression can be gained at the individual patient level but also when AD patients and controls are respectively summarized as groups. To discern differences at individual time points in the simulation, non-parametric hypothesis testing was employed to compare the protein expression distributions across cells. To also incorporate the overall trend of a cell’s development, generalized linear mixed models (GLMMs) and a functional ANOVA were used to model different aspects of the data for the AD to non-AD comparison.
GLMMs [6] are extensions of linear regression models that model a response in dependence of fixed and random effects and can stray from a normality assumption in the data by connecting the linear predictor to the data’s distribution using a link function. Fixed effects represent static influences that do not change -(time and the (AD) group belonging in this case), random effects are in themselves random variables that capture heterogeneous variability across patients.
A functional data analysis considers functions as observations and has large applicability in the analysis of longitudinal data, where the response is treated as a function of time. This can be used to more accurately model the complex developments of the simulated cell data where each cell can be interpreted as a function. A functional ANOVA [7] was used to analyze the data with respect to general significant differences between 1) patients and 2) patient groups using a collection of test statistics that can consider functional observations.
Results and conclusion
Statistical testing between AD patients and controls of the simulation data resulted in significant differences between groups for the expression of immune regulating proteins PD1 and interferon gamma at individual snapshots in time. This was also the case for pairwise testing between patients for these two variables predominantly. Qualitatively similar but shifted trajectories between patients were observed for each variable.
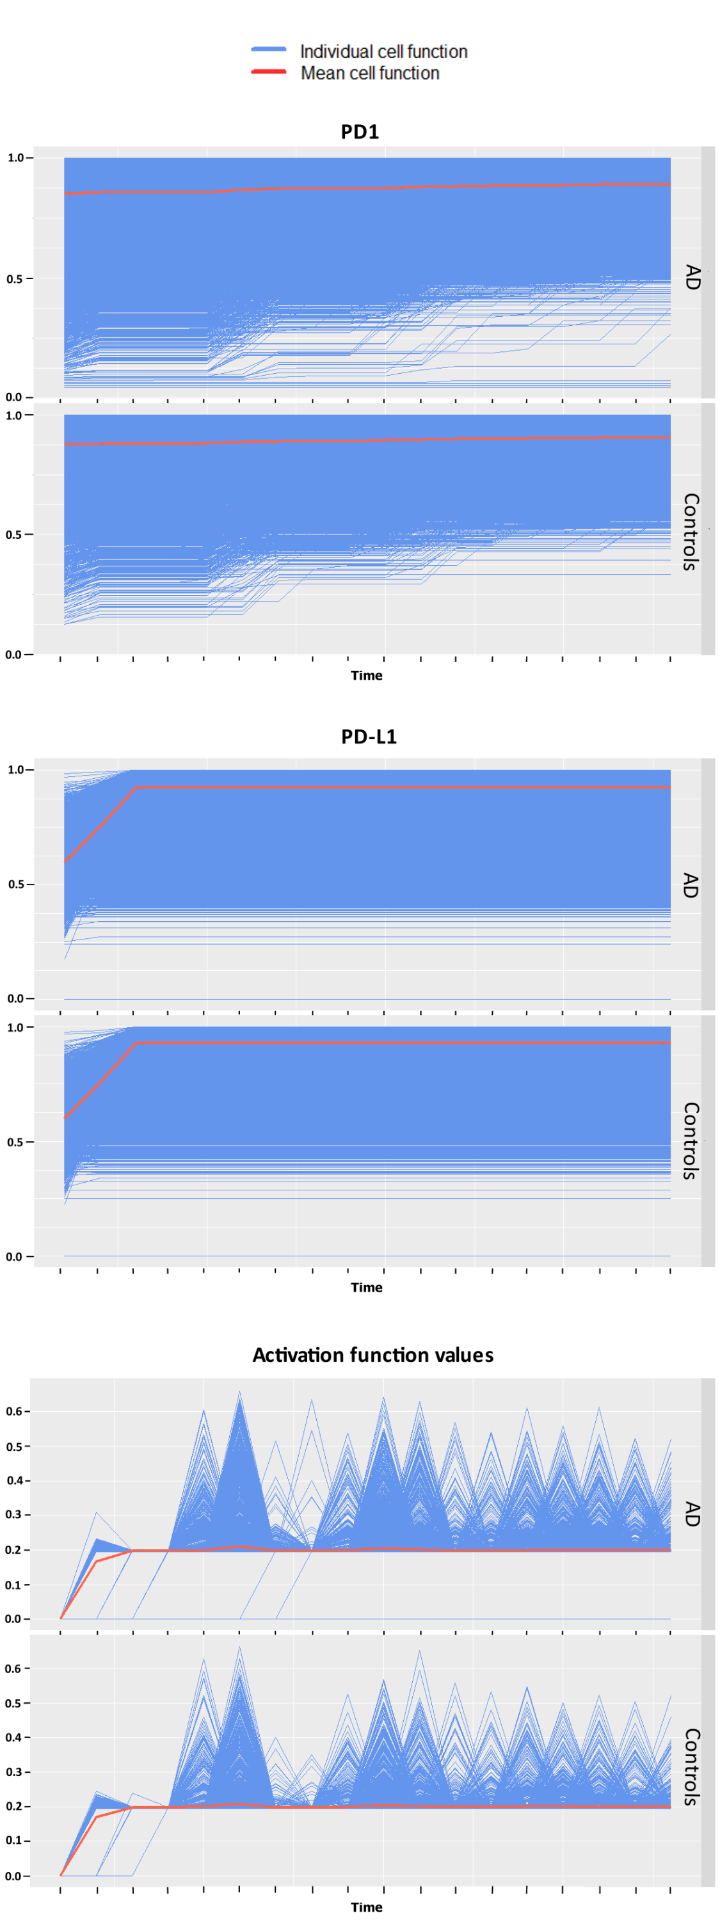
The GLMM analysis yielded significant differences in groups for PD-L1, T-cell’s activations and interferon gamma, but not for PD1 this time. The functional ANOVA found differences to be significant in regards to both patients and groups of patients for PD1, T-cell activations and for PD-L1. The cells‘ different trajectories in each group can be seen in Figure 1. The different interpretations of the expression of PD1 may resemble different patterns recognized by the two approaches. The functional ANOVA can only test one potentially confounded group allocation at a time but finds its advantage in a more powerful modeling approach that considers more complex cell-specific temporal developments that go beyond the GLMM’s linear dynamics.
The analysis shows that some marker genes that play important roles in the peripheral immune system do indeed express differently and lead to varying immune activity in AD compared to controls for the examined patients, but also needs to be critically considered in terms of major biological interpretability due to the abstraction of the computational experiment and the low statistical power caused by only considering five patients total.
References:
[1] Serafettin Gunes et al. “Biomarkers for Alzheimer’s Disease in the Current State: A Narrative Review”. In: International Journal of Molecular Sciences 23 (9 2022).
[2] Brianne M. Bettcher et al. “Peripheral and central immune system crosstalk in Alzheimer disease — a research prospectus”. In: Nature Reviews Neurology 17 (11 2021).
[3] Douglas R. Galasko et al. “A Blood Test for Alzheimer’s Disease: It’s about Time or Not Ready for Prime Time?” In: Journal of Alzheimer’s Disease 90 (3 2022).
[4] Asaf Liberman et al. „Cell studio: A platform for interactive, 3D graphical simulation of immunological processes“. In: APL Bioengineering 2 (2 2018).
[5] Hui Xu and Jianping Jia. “Single-Cell RNA Sequencing of Peripheral Blood Reveals Immune Cell Signatures in Alzheimer’s Disease”. In: Frontiers in Immunology 12 (2021).
[6] N. E. Breslow and D. G. Clayton. “Approximate Inference in Generalized Linear Mixed Models”. In: Journal of the American Statistical Association 88 (421 1993).
[7] Tomasz Górecki and Łukasz Smaga. “fdANOVA: an R software package for analysis of variance for univariate and multivariate functional data”. In: Computational Statistics 34 (2 2019).
[8] Haocheng Gu et al. “scGNN 2.0: a graph neural network tool for imputation and clustering of single-cell RNA-Seq data”. In: Bioinformatics (Oxford, England) 38 (23 2022).